|
Wavefront Analysis |
  
|
|
Wavefront Analysis |
|
Datagraph allows to plot a number of graphs which are based on the Zernike coefficient data.
All Zernike based graphs can be shown for entire eye or Ocular ('O'), Internal ('I') or Corneal ('C') WF aberration data, according to their labeling in the type column on the aberration data tab.
Since RMS values depend on pupil diameters graphs can also be filtered by pupil diameter.
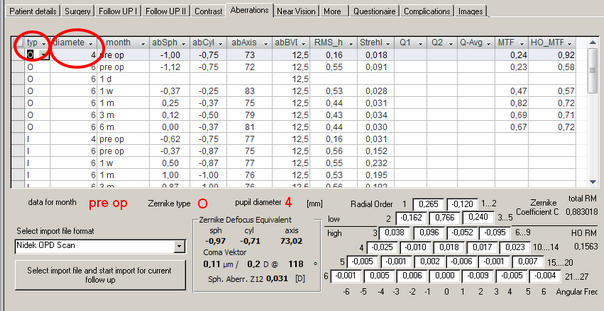
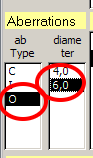
Note: There are additional options on the graph filter window when displaying any type of WF based graphs. You may select Corneal, Internal and Ocular aberration data under 'ab Type' and display graphy for different pupil diameters (selectable under 'diameter').
A meaningful comparison between different patient groups must be done always for the same pupil diameter.