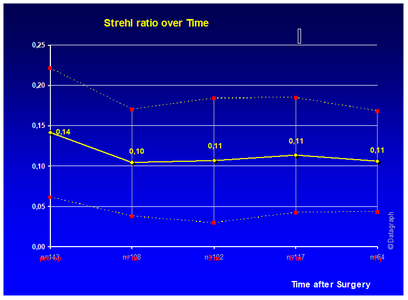
Comparing the maximum possible ('diffraction limited') Point Spread Function (PSF) with the currently measured one is expressed as 'Strehl Ratio'. Its a numeric expression of the quality of the Point Spread Function and can be graphed over time with Datagraph-med. Strehl Ratio values have to be entered on the 'aberration' tab for each follow up time interval you want to plot on this graph.
